August 14, 2026
Introducing GymOS Trade Analytics
Introducing GymOS Trade Analytics
Most traders don't have a shortage of data - after months or years of activity, a trading account can hold hundreds of historical trades. What's usually missing isn't the data itself, but a clear way to turn it into something useful. A raw trade history is hard to learn from; a summarized view of how you've actually been performing is where the real insight starts.
That's what GymOS Trade Analytics is built for.
See Your Trading Performance Clearly
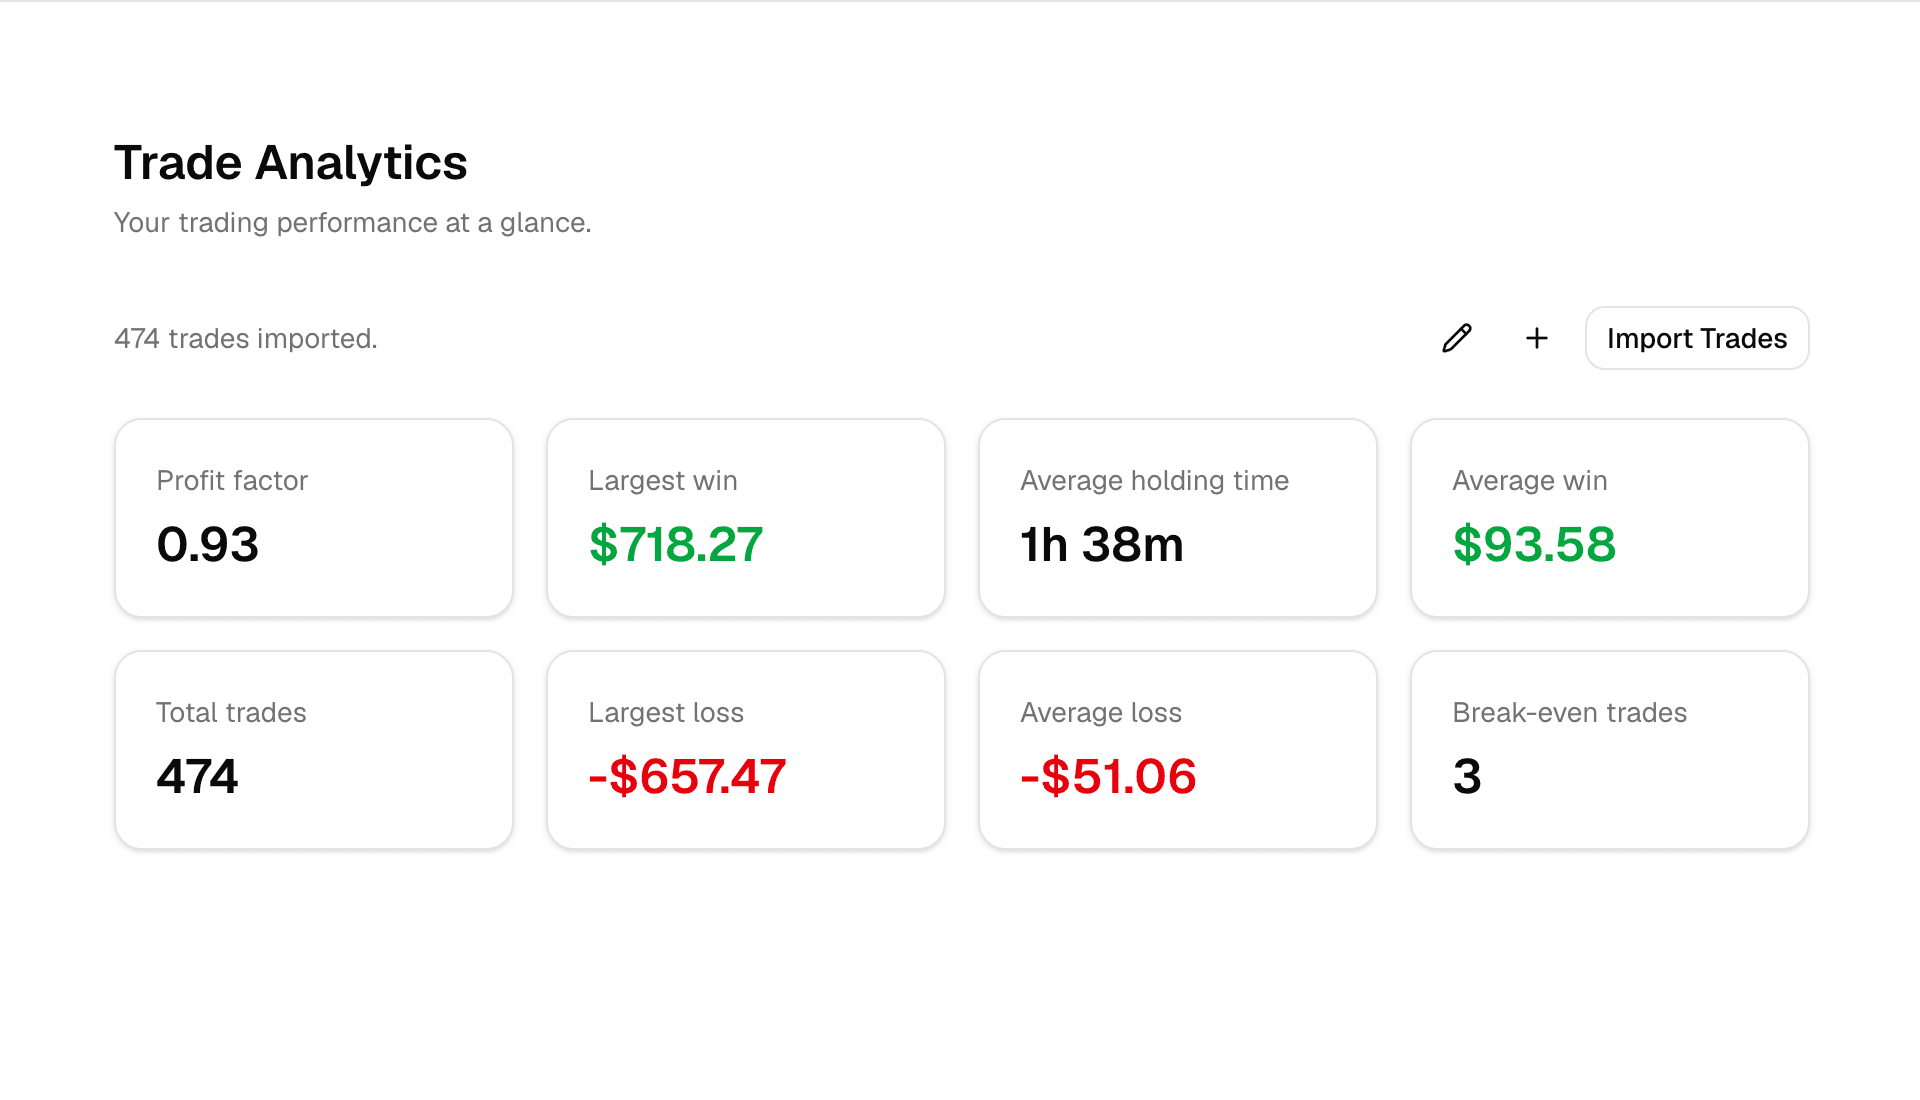
Trade Analytics takes your imported trading data and turns it into a single, clear overview of how you've been performing. Instead of scrolling through a spreadsheet of individual positions, you get a dashboard that summarizes your results at a glance - built to make patterns in your trading easier to see, not just easier to store.
Key Metrics at a Glance
The dashboard surfaces the performance metrics that matter for understanding your trading, so you can quickly get a sense of how things have been going without recalculating anything yourself. Examples of what you'll find include:
- Profit Factor - a measure of how your gains stack up against your losses
- Largest Win - your single best-performing trade
- Average Holding Time - how long you're typically staying in a position
- Average Win - what a winning trade has tended to look like for you
These are examples, not the full list - the dashboard is built to surface a broader set of metrics, and you can choose which ones matter most to you.
Import Your Trades
Getting started is straightforward: import your trading history into GymOS, and Trade Analytics takes it from there. Once your trades are in, they're immediately reflected in your dashboard, ready to explore.
Understand Your Results
Any single trade only tells you so much - a win can be luck, and a loss can still come from a sound process. Looking at your trading in aggregate is what makes patterns visible: how you tend to perform across many trades, not just the last one.
Trade Analytics is built to help you evaluate your process over time, not to predict what happens next. It doesn't offer financial advice, and using it is no guarantee of better trading results - it's a tool for understanding your own history more clearly.
Built Into GymOS
Trade Analytics is one part of the broader GymOS experience, built on the same principle as everything else in the product: take data that's hard to make sense of on its own, and turn it into something clear and usable. It's designed to fit naturally alongside the rest of your GymOS software, not as a separate tool bolted on the side.
Conclusion
Your trading history has more to tell you than a spreadsheet can show. GymOS Trade Analytics is here to help you see it clearly - import your trades, explore your dashboard, and start understanding your performance a little better.
Explore GymOS to get started.